Performance Benchmark of the SGI TP9400 RAID Storage Array
William JulienEngineering Operating Systems
Boeing Shared Services
P.O. Box 3307 MS 7j-04
Seattle, WA 98124-2207 USA
julien@sdc.cs.boeing.com425-865-5511
Copyright © The Boeing Company
Click here for slides or this paper in PDF format
|
MethodologyThere are many ways to configure a filesystem. We learned, the hard way, that a configuration that works well on one platform or application, does not necessarily provide the same performance in all situations. This paper is an account of our experiences as we transition from an Origin 2000 with scsi attached storage, to a fiber channel attached TP9400 storage array and a new 64 processor Origin 3800.To test our configuration, we used the standard SGI benchmark, diskperf(1) and a locally written tool. The diskperf utility does a very complete test of various types of I/O and it is provided in the standard IRIX distribution. As a cross check, our locally written tool called diskrate, benchmarks very simple sequential forward write and reads.
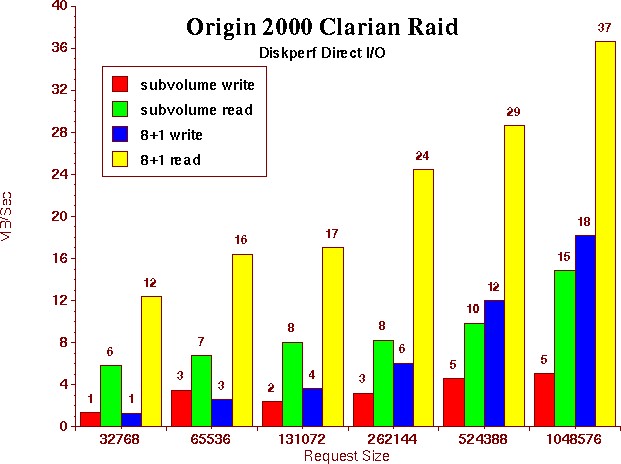
Our Humble OriginBefore I begin describing our performance experience with the TP9400 RAID storage array, we need to look, for comparison, at our humble Origin. Tuning our SGI I/O performance has been a journey, with with many lessions learned along the way. And this journey began with the analysis of our modest 8 CPU Origin 2000.The application mix on the Origin 2000 is primarily CPU bound MPI finite analysis codes. These programs, when they did perform any I/O, were predominatly write only. For this reason, performance of the I/O sub-system was not a primary concern and not part of the acceptance criteria for production. However, when we did benchmark the performance, it was alarming and in need of some serious attention. The Home and scratch filesystems were configured on a scsi attached clairian RAID storage device as an xlv. Initially, they were setup with a stripe across two sub-partitioned LUNS. Each of the LUNS were built as an raid3 8+1. This configuration is simular to how the filesystems on another, non sgi system, were built. Previous experience had shown this provided acceptable performance. After the system was put into production, a benchmark was performed. It showed we had amazingly poor I/O performance! This gave us two a very important lessons. First, we learned that one should always benchmark the performance of your I/O sub-systems. Prior experience was of little benifit. Second, we learned it is best not to sub-partition your LUNS. We found a serious performance degradation if you use these sub-partitions in a stripe. Each write had to be syncronised across all 16 spindles on the two raid3 8+1 arrays. A "before and after" diskperf benchmark demonstrates this degradation. The following graph shows that at a 1meg request block size, we were getting 5 MB/second on writes and 15 MB/second reads. It is more common for our applications to use a 65,536 request size. At this request size, the direct writes were barely 3 MB/second! This came as quite a surprise, and was clearly not acceptable. So, we reconfigured the filesystems to use a clean 8+1 lun. By eliminating the subvolume partitions, and the two lun stripe, the performance of the filesystems improved by more than double.
|
Evaluation of the TP9400A new computing requirement gave us the opportunity to upgrade our Origin service from an 8 CPU Origin 2000, to a 64 processor Origin 3800. On the new Origin 3800, we decided to use the TP9400 storage array device. This new workload had a potential for a significantly intensive I/O traffic. Learning from our previous experience, we setup a project to benchmark and evalulate the I/O performance of the TP9400 storage array. We also made this a part of our acceptance criteria for the new system.In preparation for the benchmark, SGI provided us with a loaner Origin deskside, a brocade switch, a TP9400 with a controller enclosure and one 73 GB disk enclosure. The controller was configured with 2 front end minihubs (gbics) and 4 backend minihubs, The datacenter installed an Onyx 2 system in order to perform the shared filesystem testing. Our test plan consisted of the following steps.
A learning experienceLearning how to configure the TP9400 was at first fairly difficult. We found the man pages for the various tools like xvm, cmgr, and the online help files for tpssm7 not well integrated and didn't provide an overall picture. But after some study, and some help from SGI, we managed to configure dedicated and shared cxfs filesystems. Essentually, we used the default settings in tpssm7 and xvm.
|
Dedicated Filesystem TestOur initial benchmarks found simular results from both the Origin deskside and Onyx2 systems. The PCP performance data matched very well the output results from each of our benchmarks. Also, we found no difference in performance when the TP9400 was direct attached or connected via the Brocade switch. Finally, each system's benchmarks performed on the CXFS shared filesystem were also consistant with all the previous tests. The CXFS filesystem added no degradation to the filesystem performance. A summary of these benchmarks are displayed in the following chart. |
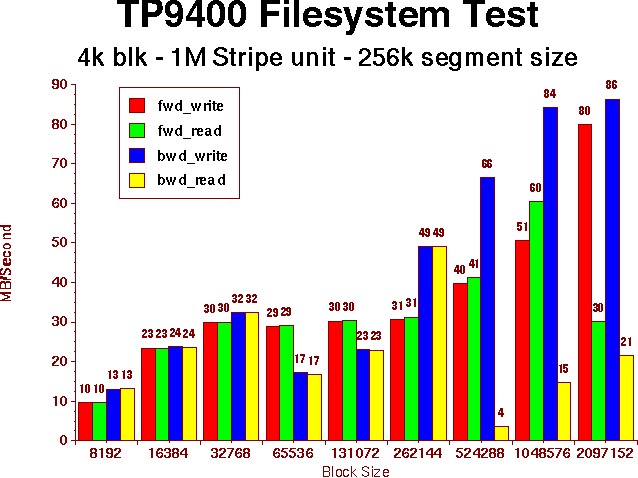
Benchmark evaluationThe results were considerably better than the benchmarks performed on our humble Origin 2000. But they were still consistantly lower than our expectations. Each Gbic mini-hub should be able to sustain a maximum of 100MB per second. Striping across the two 4+1 LUNS, we expected the transfer rates to be some what less than 200MB per second. However, the maximum observed thoughput was less than half that rate! Running simutainious tests on both systems provided the same maximum performance of around 80 MB per second. Also, running multiple streams on the same system resulted in a rate linear to 80 MB/Sec divided by the number of streams. Clearly, we were missing something in our configuration.A new concept to us in working with the TP9400 is the fact that there are multiple paths through the HBA controllers to the TP9400 controllers. Unless you configure it, the system will choose it's own primary path. After some digging, we found that the system choose the same primary paths for each of our LUNS routing all the I/O through a single minihub. The scsifo -d command displays these default paths. To improve benchmarks, we took the following actions.
|
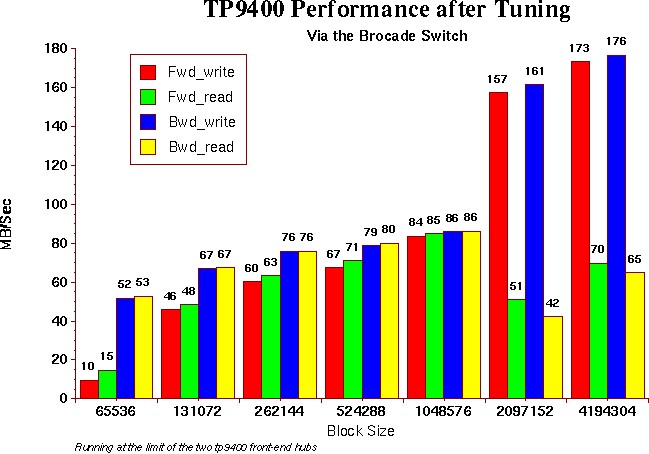
Results after TuningAs you can see from the above graph, the performance throughput considerably improved. The performance co-pilot displays showed that the I/O was evenly distributed via two HBA channels and the transfer rates where running at the limit one would expect; limited by the bandwidth of the two front end Gbic hubs. The drop in the read performance is explained by the fact we did not enable the read ahead cache. Enabling the read ahead cache can improve performance, but since our application workmix is very write intensive, we decided to configure the TP9400 cache to 80% write and 20% read and not enable the read ahead cache in order to give preference to the write operations. We are still evaluating this decision, and once more is known about the potential application workmix on the new 3800 platform, the cache ratios will be adjusted and a we will make a final decision about enabling the read ahead cache.It is also interesting to note that the knee in the performance that occurs at the stripe size boundry. This emphasizes the importance that of choosing a block size and stripe size that matches the characteristics of your applications. |

There be dragons hereIn the process of our stress testing, we discovered a serious problem. The system became unresponsive when we ran 10 streams writing to 6 Gigabyte files. The problem was reported to SGI (case number 2174429).The problem occurs with any program performing very large I/O to the TP9400 on either a cxfs or a local lxvm. It does not occur on the local jbod scsi disks. We were able to reproduce the problem with any program that performs any significant I/O, like diskperf or dd. As soon as the buffer cache is flooded, programs running before the test will continue to run, but appear to hang on exit. Once this occurs, the I/O throughput drops to less than 2MB per second. If you are lucky enough to have a session open, you have one chance to perform a killall on the programs performing the I/O. If left alone, the system will eventually recover. On our test system, one recovery took 6 hours to complete.
Sgi believes the problem is caused by something called the Macisort
routine. This routine sorts I/O operations to minimize disk
head thrashing. The I/O requests are performed not on the order
of the requests but according to the physical layout of the drive
sectors. Apparently, the kernel was spending 100% of it's resources
sorting the kernel buffer cache. Sgi provided us with a way of turning
off the Macisort. However, this did not fix the problem. After further
analysis, sgi identified the problem as bug number 817044 and is fixed
in patch number 4230. This patch requires some systune parameters.
News of this patch came to us just 12 hours before our Origin 3800 was due to be put into production. Unfortunatly, the degradation still occurs, even with xfs_dcontention set to a non-zero value, so the problem remains under investigation.
|
Summary and ConclusionsThe most important advice that I can give is that, on every I/O reconfiguration; take the time to test your I/O performance. You may be very surprised what you find! The standard IRIX distibution contains a standard tool called diskperf that does a very complete I/O performance analysis benchmark. This utility is very simple to use. For example, to perform a 3GB benchmark on the current filesystem:
256 - (LUNS * hosts)
---------------------- LUNS + hosts When you build your filesystems, try to involve as many spindles as possible. And for the best performance, never sub-partition your LUNS. We learned this lession the hard way when we initially configured the Origin 2000 system. The maximum rated performance of the TP9400 is approximatly 250 MB/second write, and 350 MB/second read. The TP9400 can have up to 4 host interfaces called front end hubs. Each of these interfaces have a performance limit of approximatly 100 MB/second. A very high performance filesystem can be built by striping across 4 LUNS, each configured as raid3 4+1. By setting your default primary paths, with the /etc/failover.conf, to evenly distribute the I/O over all 4 host bus adapter (HBA) controllers, the maximum throughput can be achieved. At the time of our benchmark, the TP9400 was configured with only two host interfaces. Also, the drives ordered were the high capacity 36GB disks. Binding a filesystem described above would make a filesystem too large for our needs, and not fit our service requirements. Performance probably would have been better if we had configured the TP9400 with the smaller 18GB drives. But this is a case there where we had to balance service definition requirements against configuring the system for maximum performance.
|