Chris Gottbrath
Chris.Gottbrath@TotalViewTech.com

http://www.totalviewtech.com/
Download slides for this presentation
This paper introduces an important new add-on product that is being developed for the TotalView Debugger. The Reverse Debugging add-on module will make the process of identifying bugs much less complex and time-consuming for software developers, computer scientists, and physical scientists. The add-on module is based on the capability to record and deterministically replay C, C++ and Fortran programs. This new paradigm will help developers by simplifying and shortening the troubleshooting process for a wide range of defects. While the add-on module is initially targeted for developers using workstations and servers with 32- and 64- bit i386 processors running Linux, TotalView Technologies expects to extend the module to address more directly the requirements special to High-Performance Computing (HPC) clusters based on commodity hardware and open source software. We would like to learn from the Cray user community what level of interest there is for this new paradigm on the Cray XT series.
Record and deterministic replay capability will provide two fundamental benefits to software developers. The first benefit is the fact that at any point in debugging they can pause the program and examine not just the current state of the program but also any of the set of states that led up to the current state. The second benefit is that stochastic problems can be pinned down and examined step by step.
This new capability will be presented to users in a way that makes exploring the past state of the program an intuitive extension of the concepts that users are already familiar with. Exploring the recorded program history will be done primarily through the ability to "step" the program backwards. The "step" concept, which most software developers quickly and firmly grasp, is turned around and used to define a point in execution state history that they might want to be able to quickly and easily reach. Because of the reuse of this familiar metaphor, it is trivial for users to begin to adopt reverse debugging.
The capability to record and deterministically replay program execution highlighted here will be provided to users as a separately licensed add-on module for the TotalView Debugger. This add-on module is currently in development -- please note that that specific product features are subject to change. Interested CUG members are encouraged to contact the author to learn how they can participate in programs to get an early preview of the technology and provide feedback to help establish future product directions.
Much of the frustration and complexity of debugging comes from the fact that programmers currently have to work in a very indirect and delicate way "backward" from the result of a bug to its cause. This observation motivates TotalView Technologies' interest in reverse debugging. Anything that would allow the programmer to work in a straightforward and predictable way towards the root cause of a bug is going to really improve and simplify debugging.
In many cases, getting the program to crash or otherwise misbehave is only the beginning of the troubleshooting process. In the most trivial bugs, the crash happens on the same line or immediately after the bug and the error becomes obvious to programmers if they are simply directed to the point where the program crashes. In many other cases, a wide gulf exists between the point in the program where it does something obviously wrong (the point of failure) and the point where the error occurs (the site of the bug). Once the programmer understands the failure on one side of the gulf she must find a way to identify the error on the other side of that gulf. The programmer naturally examines the state of the program after the failure looking for clues to help generate a troubleshooting hypothesis. Unhappily, though, sometimes failures actually erase important clues. For example, failures may overwrite previous key variable values that explain how the program got to where it is, stack backtraces may be gone or indecipherable, and memory allocations may potentially be corrupted.
Failure often means the program is unable to continue running. Restarting the program from scratch is often the first step after examining the failure. At that point the developer is looking at a fresh run of the program, before the error. The unspoken challenge is now for her to run the program, using only "forward" commands, to the point right before the error happens. If this is accomplished, then she can very carefully step through the relevant code and identify the error.
The challenge can be daunting even if the developer knows where the error is because the code may have complex iterative and conditional structure. These multiple levels mean that getting to a desired point in the program is not as simple as just setting a breakpoint on the right line. Conditional breakpoints can be used effectively in these cases, but setting them up to get the desired effects often takes some trial and error. Any mistake in this sequence can mean that the program needs to be restarted in the debugger. In other cases, the behavior of the program depends on input that is difficult to reproduce, and coaxing the program back into the desired state requires a lot of effort to feed the process just the right data. Ultimately, the developer should get to a point where she can either confirm or disprove her initial idea. If her initial idea is wrong, then she moves on to the next most likely hypothesis.
The degree of difficulty and frustration only goes up if the program is unfamiliar to the user or if the program contains concurrency. Doing this kind of troubleshooting with unfamiliar code means that the developer may find himself spending time to understand details of the program simply for the purpose of finding out how to "drive" the program without losing control. Concurrency, such as that introduced by multiple threads or multiple processes, may mean that the behavior of the program depends the order and timing of the threads' execution on the hardware. In such a case, restarting the program may simply result in a run of the program where fallout does not occur or occurs in a different way. The only way to eliminate this stochasticity is to carefully drive the program, starting and stopping processes or threads, such that critical sequences happen the same way every time. All of this means time spent focusing on code that relates only in the most incidental way to the problem at hand.
Examples of non-trivial bugs are not hard to find. [8] Many of our customers have told us that memory leaks and array bounds violations account for a majority of the time that they spend debugging. It is not that these are the most frequent bugs but rather that they are inordinately time consuming to resolve. A common characteristic of both of these classes of bugs is a wide gulf between error and failure. The initial memory leak or array bound violation simply sets the stage for the program to fail at some distant time in the future.
What would troubleshooting be like if all of these challenges could be sidestepped? If the developer can go backwards there is no need to restart, and therefore no risk that a stochastic problem will be gone. Nor is the programmer required to focus on the challenge of driving the program carefully forward over the same ground to just the right point. Because the programmer isn't required to focus on driving the program precisely forward, they are much less likely to spend time dwelling on uninteresting swaths of the program. Opening up the potential to "go directly backwards" radically simplifies the task at hand when a developer is troubleshooting an error in their program.
The radical simplification of the troubleshooting process outlined above would seem to apply with very little change to parallel contexts. Many of the problems that occur in parallel programs are serial bugs that occur on one or many of the parallel processes. In that case, the general idea will simply be to capture the bug in the reverse debugger and focus on analyzing the history of that specific process to work backward from the failure to the error. If that is not possible, it is still likely that an error on process A occurred generating data that when transmitted to process B caused the failure to occur there. In that case, the hunt backwards from the failure in process B should end at the point that it received the suspect data from process A. The focus of investigation can then simply switch to process A and proceed from the sending of the suspect data to the point of the original error.
Tracking down a serial error in a parallel program based on message passing therefore may not require the parallel debugger to construct an absolute mapping of execution trajectory to an absolute time across the cluster. It is not yet clear if a synchronized parallel clock will end up being relevant for errors that boil down to being more directly related to the parallel nature of parallel programs.
The existing technology that most HPC users will be familiar with that is related to this work is checkpoint/restart. Seamless checkpoint and restart generally requires the OS and/or MPI library to provide significant infrastructure specifically to allow processes to be resumed and external resources (such as files and network connections) to be operated on by the appropriate handles already defined within the code.
The TotalView Debugger can take advantage of underlying OS and runtime hooks for checkpointing programs and restarting. TotalView provides some support for this kind of debugging on IRIX and AIX where these kinds of hooks have existed for some time.
The technologies used for checkpointing and restarting at the MPI level are significantly similar to the technologies used for providing fault tolerance in distributed and parallel jobs. Some members of the OpenMPI project have written recently about how a debugger might take advantage of some of the infrastructure that OpenMPI makes available for fault tolerance. [2] A likely obstacle for this approach is that the developer has to manually manage much of the process that stores historical program behavior. The technology outlined in this paper is much easier for the user since she is not asked to explicitly manage the history mechanism. That having been said, there appear to be some interesting benefits to the fault tolerance-based approach.
There are a number of other products, papers and initiatives in the broader software development market that address or support the general idea of reverse debugging. A few are highlighted here, but this list is by no means exhaustive. The Center for Software Excellence at Microsoft has given a presentation about a technology that records all the operations in the program at a very low level. [1] The presentation mentions the trace file size and performance overhead as limitations to this general approach and then highlights some optimizations used in this research project to minimize trace-file size. Virtual machines provide an opportunity to record and replay the state not just of a single process but of an entire operating system. [4] A company called GreenHills provides a hardware-level reverse debugging tool called TimeMachine. [3] For java programming there is a tool called the Omniscient debugger that appears to provide a very transparent reverse debugging functionality. [5] None of these tools are focused on the needs of scientists and computer scientists working on multi-threaded and multi-process compiled applications. However, they do reflect the broad interest that software developers have for the kind of radically simpler troubleshooting that reverse debugging can provide.
The TotalView Debugger is a source code debugger for scientists and engineers troubleshooting complex, multi-threaded, or multi-process programs. It simplifies and shortens the troubleshooting process necessary to understand bugs and ultimately resolves defects in desktop applications, programs running on servers, and scientific simulations running on clusters. Offering extreme scalability, the TotalView Debugger also features memory debugging, programmability, and powerful visualization and analytical capabilities and supports a range of platforms, including the Cray XT series.
Cray XT series supercomputers can be run in two modes of operation, Catamount or Compute Node Linux (CNL). The TotalView Debugger supports both modes of operation and customers should be aware that customers who purchased licenses for the Cray XT Catamount version of TotalView Debugger can migrate to the Cray XT CNL version of TotalView Debugger at no cost -- contact TotalView Technologies (or Cray if the license was purchased via Cray) for details. In addition to supporting both the Catamount and CNL on the Cray XT series, TotalView Debugger is also available for the Cray X1 and X2.
TotalView Debugger provides the same look and feel across a wide range of platforms so scientists and developers moving to the Cray can leverage their experience using TotalView on platforms ranging from other x86 and x86-64 Linux clusters, other specialized HPC systems such as the NEC SX, BlueGene/L, BlueGene/P all the way down to workstations and servers running other Linux, Unix and Apple OS X operating systems (such as Linux power, Linux ia64, Mac OS X Intel and Power, Solaris Sparc and Solaris x86-64, AIX, IRIX, Tru64). TotalView will also be available in the near future for debugging applications running on Cell processor-based Linux systems.
TotalView supports debugging of applications written in C, C++, Fortran 77, Fortran 90, or UPC and is compatible with a number of different compiler families including the GCC compiler collection, the Pathscale compilers, the PGI C/C++ and Fortran compilers, and the Intel compiler family. It also supports applications that make use of MPI, UPC, OpenMP, and hybrid MPI/OpenMP architectures. Specific support has been provided to allow TotalView to work with the yod and aprun launcher mechanisms on the Cray XT Series. [6]
The scalability of TotalView Debugger is extremely well suited for the Cray XT series, because it can debug from one to thousands of processes regularly on a number of architectures. In recent measurements on a large scale Cray XT CNL system, almost all interactive debugging operations (excluding initial parallel process start up) on programs with 2,000 separate processes took less than a few seconds. TotalView is also capable of running on a higher scale, depending on the system configuration and application characteristics. TotalView has been tested and shown to work on the Cray XT series at up to 6,144 processes. Interactive performance at these very large scales is an area of active development. We've recently made very significant improvements to the interactive performance of several important operations (such as start up time) on the Cray XT as part of a systematic performance measurement and performance tuning activity carried out with the help of Oak Ridge National Labs. TotalView's architecture has been shown to work on up to 32 thousand processes on Blue Gene systems.
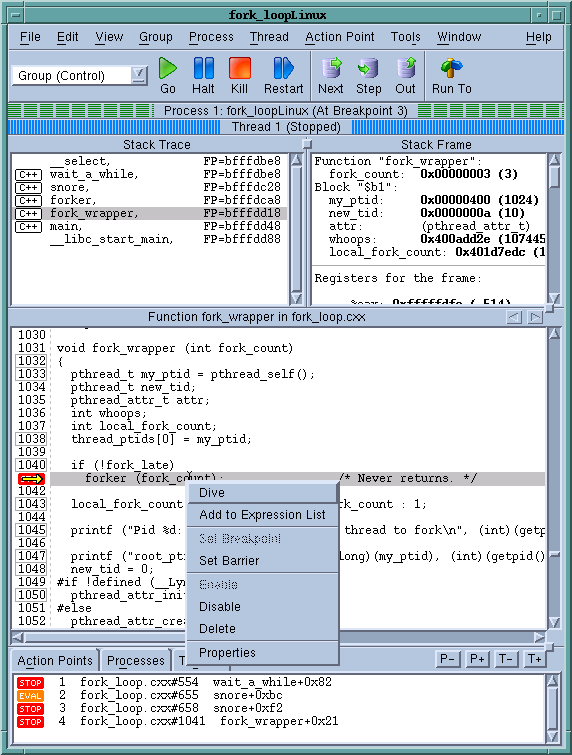
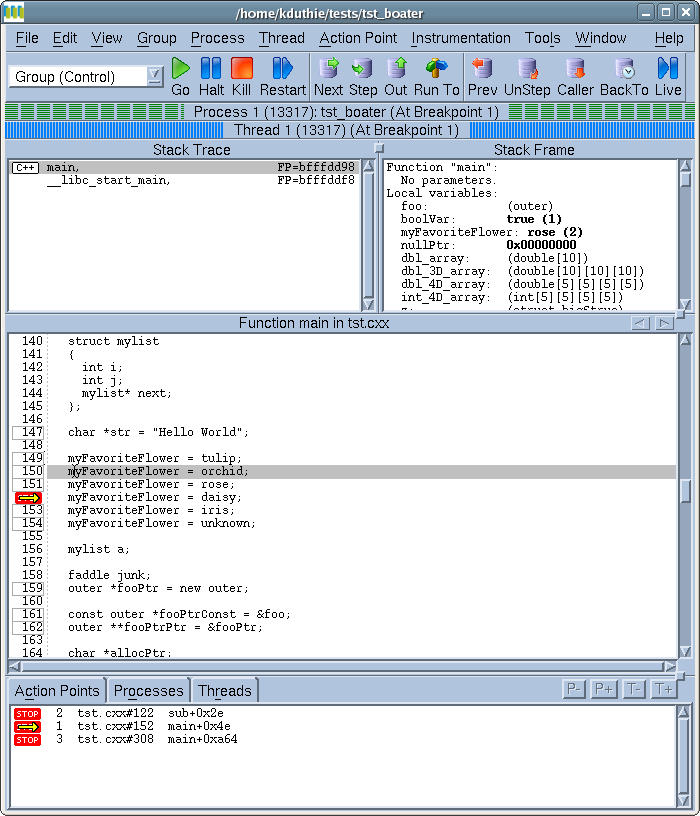
TotalView Debugger is first and foremost a graphical debugger. It presents the user the program, its current data and state of execution, and a series of simple-to-use buttons and menu items.
The user's code is represented front and center in the middle of the TotalView Debugger process window, with the function call stack and the local variables displayed in nearby areas of the window. A small set of important operations like stepping are done via prominently placed buttons; more rarely used features are available through the menu system. Looking at a function is as simple as clicking on that function name in the function call stack pane. The developer or scientist can set a breakpoint with a single click on the relevant line number. The windows representing the user's code and data are all highly interactive. The user can use the mouse to "dive" on any function, variable, pointer, element, thread, process, or breakpoint in order to see more detail about it. Forward and back navigation (similar to what users are accustomed to from working with the web) is available whenever the user is diving on a function or variable. Between the basic interface and the "dive" concept users have a very gentle learning curve to approach the more sophisticated capabilities offered by the debugger. While some users explore advanced techniques such as scripting with the command line interface, most users find all that they need in the GUI.
Many debugging sessions use just the easiest-to-locate features of the TotalView Debugger. However, if and when the troubleshooting process requires more nuanced inspection of or control over the application, TotalView provides a rich set of advanced features that can be called upon.
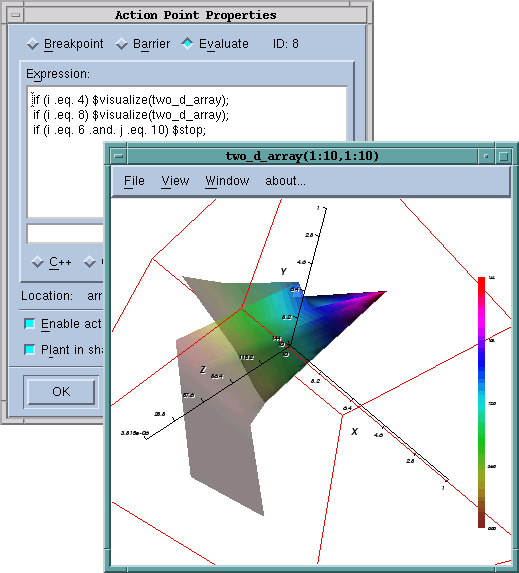
A smaller number of troubleshooting situations require the analysis of large and/or complex data sets. TotalView gives the developer a great deal of flexibility in the representation of data, effectively giving them the ability to easily navigate complex structures that contain references and types whose interpretation depends on other parts of the program. Scientists and developers can often recognize correct and incorrect patterns within their programs if they are shown the data. TotalView users can call up graphical representation of program data (surface plots of arrays), program state (program call graph), communication state (MPI message queues), and memory management state (heap statistics and heap graphical display) to look for these patterns. TotalView can help the user flag erroneous patterns by providing statistical analysis of program data, detecting cycles within communication patterns, and highlighting leaked blocks of memory.
Sometimes the sheer volume of data threatens to overwhelm the developer - and TotalView provides coping mechanisms. TotalView can display sliced and filtered portions of very large array type data sets, can subset attach to very large parallel applications, can filter data displayed on the message queue and program call graphs, and provides a Boolean filtering mechanism on heap memory data.
If the problem relates to the way data changes as the program executes, TotalView allows users to set watchpoints on any memory location. These watchpoints are somewhat like breakpoints that trigger when the memory value at the location changes. As a more advanced technique, watchpoints can be set that only trigger when some specific condition that may involve the old and new value is true. When examining program data in various data exploration windows, TotalView highlights recently changed values.
For the "racey" or more difficult to reproduce bugs the developer may need to take a more active role in "steering" the application in order to reproduce an otherwise rare situation, input data or sequence of concurrent operations. In these cases, TotalView users can leverage an unparalleled degree of process control. The developer can also inject data by adjusting the value of variables or registers. With scripting, memory painting and hoarding, and the ability to call functions and C++ methods, reset the program counter, and even "patch" the program on the fly without recompilation, an advanced user can concentrate on the code, confident of her ability to reproduce even the most obscure scenario.
TotalView provides a fully programmable and scriptable command line interface enabling programmers to systematically look at data and/or control program execution, Two of the unique features of the TotalView command line interface are that it remains asynchronous and that individual commands can be "directed at" arbitrary sets of threads and/or processes. This means that a scientist can request the value of a variable as it exists in hundreds or thousands of processes with a single command. The output of such a command can easily be captured, parsed, and analyzed "in place" in the debugging script. The TotalView command line interface is asynchronous in that one or more processes can be running while the interface is accepting input, and commands that continue one or more process return right away.
The TotalView Debugger provides a powerful environment for debugging parallel programs. It allows users to easily control and inspect applications that are composed of not just a single process, but sets of thousands of processes running across the many compute nodes of a supercomputer.
TotalView's user interface is built around the idea that the user typically wants to focus on a single process from among the many that make up their parallel application. At any point they may wish to work with this process alone, work with this process and related other processes, or work with all the processes that make up the job. Alternatively, they may want to switch their focus to another process.
The root window provides one way for a scientist to navigate the many processes that make up their job. It provides a list of all of the processes (and optionally some or all of the threads) of the job or jobs that the user is attached to. It can be used in several ways. The default organization lists all the processes that make up the job in MPI_COMM_WORLD rank order. For very large jobs, it is sometimes convenient to switch the root window to sort processes by their current state (running, stopped, at a breakpoint, etc.). These states can be "rolled-up" for easier viewing.
Processes are also displayed graphically on the processes tab of each process window, making it easier for users to understand and use process groups in TotalView. Process groups can be defined in a number of ways and used whenever the user wants to query or control the program. A group is automatically defined for any set of processes that are "in lockstep" with the current process. This makes it easy to work with a set of closely related processes. Groups can be easily defined based on characteristics such as their MPI communicator membership or their state at a given moment in time. Alternatively, the user can define arbitrary groupings based on her knowledge of the program structure. Data inspection, evaluation and process control commands can operate on any of these groups. Breakpoints, watchpoints, and barrier objects can all operate narrowly on single threads, processes, on groups of processes, or entire parallel applications.
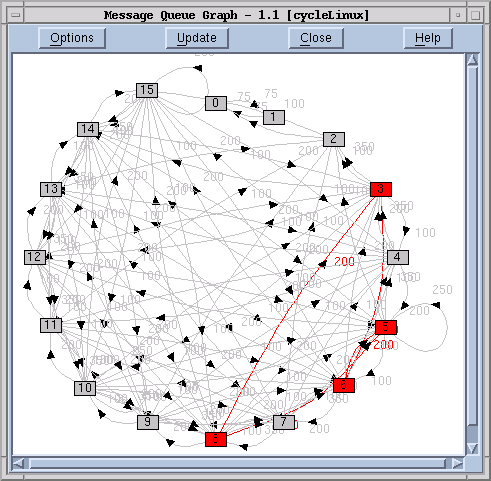
Graphical representations of complex data are often much easier for scientists and developers to look at and analyze. When working with many processes, there are two important graphical representations that TotalView can provide. The call graph provides a compact way for developers to see what the current point of execution is for the many processes in a large parallel job. The message queue graph provides a compact way for developers to see what is going on with message communication between processes in a large parallel job.
One advanced capability that TotalView offers that can significantly aid users who are working at extreme scales is subset attach. TotalView does not need to be attached to an entire parallel job; it can attach to any arbitrary subset. Any processes that are not attached in the debugger will run freely and participate in the parallel program. This subset of attached processes can change over time as the user explores their parallel application.
Subset attach does require some support on the part of the MPI library. Currently subset attach is not supported with aprun on CNL, but we are working closely with Cray engineers to have it available in the near future.
The TotalView Debugger implements an integrated memory debugging tool that provides vital information about the state of program heap memory. It reports some errors directly as they occur, provides graphical and interactive maps of the heap memory within individual processes, and makes information such as the set of leaked blocks easy to obtain. TotalView Debugger's memory debugging capabilities are designed to be used with parallel applications. It can provide both detailed information about individual processes as well as high-level memory usage statistics across all the processes that make up large parallel applications. TotalView's memory debugging is lightweight and has a very low runtime performance cost.
Memory Debugging is supported on both Catamont and CNL style Cray XT systems. It is not available on the Cray X1 and Cray X2.
TotalView accomplishes memory debugging on the Cray XT through the use of a technique called interposition. TotalView provides a library called the Heap Interposition Agent (HIA) that is inserted between the user's application code and the malloc() subsystem. On systems that support dynamic libraries this is done at program run time. On both Catamount and CNL, users do need to re-link their application to use memory debugging. See the documentation for details on how to do this. [7] This library defines functions for each of the memory allocation API functions and it is these functions that are initially called by the program whenever it allocates, reallocates, or frees a block of memory.
Interposition differs from simply replacing the malloc library with a debug malloc in that the interposition library does not actually fulfill any of the operations itself; it arranges for the program's malloc API function calls to be forwarded to the underlying heap manager that would have been called in the absence of the HIA. The effect of interposing with the HIA is that the program behaves the same way it would without the HIA, except that the HIA is able to intercept all of the memory calls and perform bookkeeping and sanity checks before and after the underlying function is called.
TotalView provides a range of heap status reports, the most popular of which is the heap graphical display. At any point where a process has been stopped, the user can get a graphical view of the heap. The heap graphical display paints a picture of the heap memory in the selected process. Each current heap memory allocation is represented by a green bar extending across the range of addresses that are part of the allocation. The view is interactive - selecting a block highlights related allocations and presents the user with detailed information about both the selected block and the full set of related blocks. The display can be filtered to dim allocations based on their properties (such as their size or what shared object they were allocated in).
The Memory Statistics tab of the Memory Debugging window in TotalView will provide overall memory usage statistics in a number of graphical forms (line, bar and pie charts) for one, all, or an arbitrary subset of the processes that make up the debugging session.
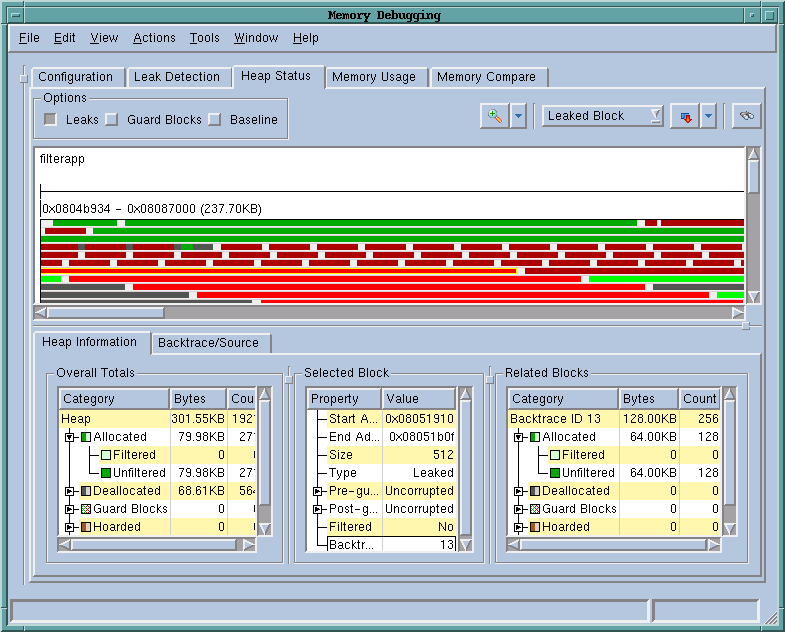
Leak detection can be done at any point in program execution. Most leaks occur when the program ceases using a block of memory without calling free. Although it is difficult to define "ceasing to use," the debugger is able to do leak detection by looking to see if the program retains a reference to specific memory locations. The result of doing a leak detection operation on a process is a list of the specific allocations (presented in terms of where they were allocated in the sources or graphically as red blocks on the heap graphical display) for which there are no locatable references in the program. A block of memory that the program isn't storing a reference to anywhere is highly unlikely to subsequently be subject to a free() call and is extremely likely to be a leak.
Developers may suspect that they have a "wild pointer" or array bounds violation that is corrupting memory. In either case they may be able to track down the problem by using heap guard blocks in the memory debugging component of the TotalView Debugger. The result of reading and writing before the beginning of a block of memory, or after the end of the block of memory, is undefined. The HIA can place a "reserved region" with known data values before and/or after individual heap memory allocations. If at any point these data values change that means the program was writing where it was not supposed to be writing.
For memory debugging of very large scale jobs, TotalView provides developers with an alternate way of doing memory debugging that can be used more naturally with batch environments and has somewhat reduced overhead. This mode, referred to as lightweight memory core file debugging, allows the user to prepare her application and run it without the debugger attached. Then when memory events occur, or at the end of the job run, the HIA can generate a file that contains various kinds of information about the error or the status of the heap. These files, like a traditional corefile, can be later opened in TotalView to browse the information they contain.
Work currently being done to support subset attach using aprun on Cray XT series CNL supercomputers. Work is also ongoing at TotalView to improve the usability of TotalView for our High-Performance Computing (HPC) customers.
Many of the scientists and software developers who could benefit from TotalView are taking advantage of unique computational resources that are centrally located at an HPC center. These developers are rarely physically on-site at the HPC center and often log in over a long-distance network connection. They do most of their work through the command line and may or may not even know how to set up a graphical connection. Future versions of the TotalView Debugger will be able to greatly simplify setting up and accelerate displaying a full interactive graphical user interface over long-distance connections.
Another reality for many of our users is their usual process for using high-performance computers is via a "batch" resource management system. In this case, the user may be very comfortable using a command line interface to set up a job, submit that job to the batch queue, then receive and analyze results generated by the job. Future versions of the TotalView Debugger will be easy to use in a non-interactive way that meshes easily with batch queue workflows and environments.
The reverse debugging capability provided by the TotalView add-on relies on the ability to record and deterministically replay the execution of each individual process in the program. The debugger arranges for each target process to load an instrumentation library that manages the process of recording and replaying execution history. For the most part, the debugger operates on each process as it would otherwise do to suspend execution, read and write registers and memory, set breakpoints, and resume the process or individual threads. In addition to these operations, the add-on module gives the debugger the ability to instruct the process to "go to" any previous point in execution history. The instrumentation library transparently takes any action necessary to put the process into the right state so that the debugger can then query registers and memory from that point in "recorded" history.
One of the challenges tackled by the instrumentation library is recording enough of the program execution to allow the program to be re-executed along exactly the same trajectory over and over again. This includes inputs such as data from external files, data transmitted over the network, and the return value of system calls. Another important factor that needs to be recorded in order to reproduce program behavior is the sequence of thread execution. The benefits of the implementation of this functionality in the TotalView Reverse Debugging add-on are that this recording is done efficiently, both in terms of the time that it takes to record the information and in terms of the volume of data recorded.
Given its ability to record program execution, the instrumentation library can reproduce any point on the trajectory of the program by starting from a previous known state and replaying the program forward in a controlled fashion. During this replay the "simulated" process reads data and makes system calls that all return the values that were recorded during the execution of the "real" process. The instrumentation library manages a collection of known states in such a way that most backwards stepping operations can be done with little delay. However, there may also be points in execution history that will take more than a few seconds to reach -- especially in very long running processes.
The architecture mentioned here has some implications that are worth reviewing.
The instrumentation library needs to make the execution trajectory deterministic in programs that have multiple threads per process. It does this by ensuring that only one thread at a time runs, which may significantly impact the performance of some programs.
Recording process behavior incurs some significant overhead, which will vary from process to process depending on individual characteristics. This overhead comes in the form of execution time and memory usage.
Under some circumstances, the process being debugged may need to write output to a file.
During the replay of recorded "execution history" some of the operations that TotalView users are accustomed to using may not be available (e.g. setting program variables, "set pc," and full asynchr onous thread control) because their use would cause the simulated execution to depart from the recorded trajectory.
Cluster resources such as the Cray XT series are almost always run in a mode where individual user's jobs are managed and accounted for using a resource management system. Looking at troubleshooting and debugging as a process, reverse debugging seeks to eliminate and shorten the process cycles by allowing the developer to work backwards from failure to error. However, this improvement involves a trade off between many shorter runs and a single longer run. For this to be adopted by users of such clusters, the rules governing access may need to allow for longer running single jobs in the portion of the machine set aside for interactive debugging.
The Reverse Debugging add-on is being developed initially for more "traditional" Linux-x86 and Linux-x86-64 single node systems. Please let TotalView Technologies know if you are interested in having this technology available for Cray XT CNL systems.
There are at least three different operations that will be important when developers are working "backwards" through their program.
The simplest, easiest to understand, and most frequently used mechanism for inspecting the historical state of the program is to step backwards line-by-line through the program. This is an analog of stepping in the forward direction and the same kind of rules apply. If a developer is stepping through a loop construct, back stepping from the top line will take them to the conditional, then back into the bottom of the loop.
As with forward stepping, there are several slight variations on the stepping theme for backwards stepping. The "back next" operation takes the target program backwards over a single executable line of code at the same scope level, even if it contains one or more function calls. The "back step" operation takes the target program backwards over a line of code -- unless that line of code contains one or more functions, in which case it takes the target program to the previously executed line of code even if that line occurs in one of the called subroutines. In either of the previous cases, backwards stepping from the first line in a function will take the program to the point in time before the function was called. When working in a function, "back out" will take the program to the line just before the current function was called.
Together, these operations give the developer easy access to the recent past of the program's execution. They can be coupled with forward stepping commands -- so the developer can, if they wish, step back and forth over a single line many times, if that is what is needed to understand what is going on. This make should unfamiliar programs much easier to work with since any nuances of the program's behavior that are missed at first can be picked up on further examination.
While developers do often step line-by-line through interesting sections of programs, there are other sections of the program that are simply not that interesting, so developers need a way to skip back over longer stretches of the program. This is provided by the "run back to" operation that lets the developer examine the state of the program at the most recent time the program was at any given line. The selected line might simply be a line in the same function, a line in a calling function, a line in any other function that happened to have been called previously in the program, or a line in main. This is a direct analog of the TotalView "run to" command, which works the same way but in the forward direction. "Run to" is itself a shortcut for setting a breakpoint on a line of code then continuing the program.
Two situations where this ability is particularly effective are when the function being examined contains one or more loop constructs. Rather than stepping around the loop many times, developers can simply jump to before the loop started. Another situation is returning to an earlier program phase by selecting lines in the top level program structure that represent these phases.
In some cases there isn't a specific line that defines the point in the execution history that the developer wishes to examine. In these cases the Reverse Debugging add-on will give the user the ability to specify a time directly and ask to inspect the program at that point. This is analogous to simply continuing then halting a program in the forward direction.
One simple use of this capability is the idea of leaping back to the beginning of the program, because there may be some information, such as the address of a variable that has been inexplicably corrupted, which can be used to set up something like a watchpoint. Another common use will be to perform manual binary searches of execution history for poorly understood and localized events.
TotalView provides both a Graphical User Interface (GUI) and a Command Line Interface (CLI). Most features in TotalView can be driven using either interface. The same thing is true for the capabilities provided by the Reverse Debugging add-on module.
The Graphical User Interface (GUI) for TotalView is how most users will experience the Reverse Debugging add-on module.
To get started with reverse debugging on a specific process, developers simply designate that they wish to have it enabled. This can be done by selecting a checkbox in the new program dialog. No further user action is required -- the debugger takes care of starting the program in such a way that the instrumentation library is loaded.
The existing TotalView process window contains a series of prominently placed buttons for the stepping commands. The new backwards stepping commands have been added right next to the forward stepping commands. The fact that the backwards stepping commands are such close analogs of the forward stepping commands should make these operations very easy to understand, even when a user does nothing more than click on a few of them. The "run back to" command, like the forward debugging "run to" command requires the user to select a line in the program before it makes itself available.
Another important function that has not yet been discussed is how to get back to record mode after examining historical state. Simply forward stepping back out of history will work. Alternately the "return to live" button will be available on the process window toolbar.
The Command Line Interface (CLI) for TotalView is less frequently used for day-to-day interactive debugging, and is best used when developers want to script, extend or programmatically drive the debugger through a precise series of operations. Existing commands such as dstep have been extended to have a new -back flag that allows them to be used in the reverse direction.
The direct access to history, described above, will initially be presented just in the CLI. In that context a query command will allow developers to see a numeric "time-like" measure of where along the process's execution history the program is. A "go to time X" command will be provided to allow developers to randomly access the execution history.
There are many areas for future work related to this technology, only a few of which are highlighted here.
The ability to examine not just the current state, but states leading up to the current state, has the potential to provide developers with much more information about their program. How will developers want to work with this new dimension of time? What questions do they want to be able to ask about their program and how do they want the answers displayed to them?
The generality of the use case for reverse debugging suggests that there will be a lot of interest for it within the High-Performance Computing community. One of the interesting questions is how reverse debugging will be used within the HPC community - to what extent will the use cases differ? What impact will the different workloads, favored technologies, and environmental factors of HPC have on the way that people approach this new way to troubleshoot?
Computer and computational scientists, software engineers and application developers will soon be able to use reverse debugging to greatly simplify the troubleshooting process to understand and resolve defects in a wide range of computer programs. This advance is based on the technical capability to record and replay program execution which will minimize the need to repetitively restart programs. The Reverse Debugging add-on module will intuitively extend TotalView Debugger's existing capabilities and deliver these benefits to both casual and more advanced TotalView users.